Sorting and Filtering the Results Grid
Energy Documents limits results to 1,000 rows. When results are truncated, Energy Documents displays a notification at the bottom of the results grid, so that you can refine your search criteria.

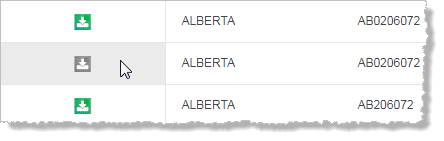
A document download icon that is grayed out ( ) indicates that you are entitled to view and download the data, but all your seat licenses are currently in use.
Hover over the image above to enlarge it.
Try again later when a seat is available, or select ![]() > Subscription Inquiry to contact your sales representative to either purchase additional seats or to upgrade to a site license.
> Subscription Inquiry to contact your sales representative to either purchase additional seats or to upgrade to a site license.
Energy Documents uses two cookies:
- Data entitlements cookie - enables your data entitlements. This cookie is mandatory.
- Grid preferences cookie - saves your grid state preferences. This cookie is optional.
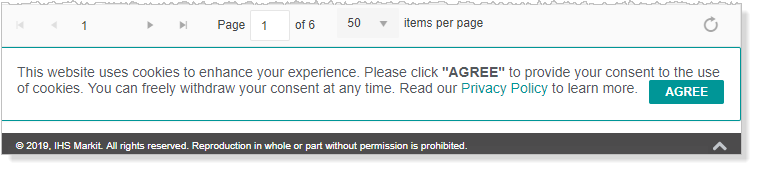
A banner prompts you to accept the grid preferences cookie. If you accept the cookie your current and ongoing grid preferences are saved. This includes columns displayed, column ordering, items per page, grouping, and sorting. You don't need to customize the grid during future Energy Documents sessions, and you won't lose your current grid settings if you refresh your browser window in the current session. Search strings that resulted in the current view, and filters applied to the results grid are not saved.
The grid preferences banner is displayed, and your grid preferences are not saved until you accept the cookie.
Hover over the image above to enlarge it.
If you delete cookies as part of your browser maintenance routine, the Energy Documents cookie is removed and you need to both accept the cookie and to customize the grid again.
Click the column name to sort the data grid in ascending or descending values for a single column. An arrow appears in the right side of the column header indicating whether the column is sorted in ascending ( ) or descending (
 ) order. Sorting is intelligent, in that if you sort a column of numbers, the entire number in each cell is evaluated for placement. A UWI sort uses the standard sort of meridian, township, range.
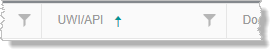
When a filter is applied ( ), the name of the column to which the filter is applied appears in the row above the data grid as a visual reminder for when the filtered column is out of sight or disabled.
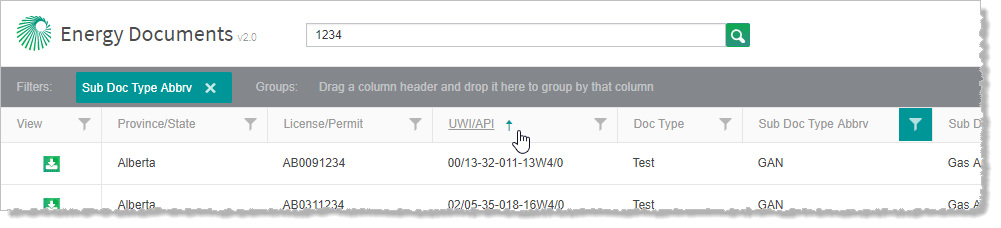
Hover over the image above to enlarge it.
Only one column can be filtered at a time. When a second filter is enabled, the first filter is disabled.
A revised result display count appears in the bottom-right of the screen indicating the volume of displayed vs. actual search results.
Where grouping is applied as well as filtering, the filtering indicator label is colored green and appears after the Filters label.
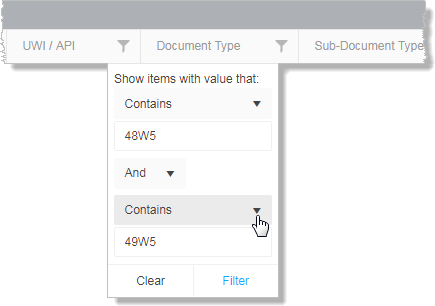
Click Filter ( ) in a column header to display a popup box where you specify the values or ranges within that column to include, and then click Filter in the bottom-right of the popup box.
The type of data you can choose from depends on the data in the column and the search results.
Filter the data grid by selecting the type of data, actual values, or the query value to display. Filters are themed according to the data found in a column and include the following types:
- Less/Greater Than - for numeric values, select a single value, or specify a range within which or outside of which the data to display falls.
-
Date - set the date range using the calendar control ( ) or by typing a date in the format YYYY-MM-DD. Define both start and end dates, or specify one to retrieve everything either after or up to a certain date.
Contains - the filter option for data fields that are unique and too large to display all available options. UWI only uses the Contains Boolean operand, which allows for partial or full search terms.
Check box - the filter option for fixed types of data such as file extension, or confidentiality type can be specified using a check box that appears in the drop-down list. This only shows the available options from your current results grid.


- If there is a large volume of entries in the popup box, use the Search (
 ) feature at the top of the popup box to narrow the results from which you can choose.

All rows that do not include the desired selection(s) are hidden from the current data grid view.
To clear the filter, either click X to the right of the filter label that appears in the row above the data grid, or click Filter (![]() ) to display the popup box, and either click a selected check box to clear the checkmark for that particular item, or click Clear in the bottom-left of the popup box to remove all of the filters applied in this specific column. You can also click the X in the right of the filter indicator box that appears in the pane above the data grid as depicted below.
) to display the popup box, and either click a selected check box to clear the checkmark for that particular item, or click Clear in the bottom-left of the popup box to remove all of the filters applied in this specific column. You can also click the X in the right of the filter indicator box that appears in the pane above the data grid as depicted below.
When filtering by Doc Type or Sub Doc Type, it helps to understand how S&P Global historically captured and stored this data. Previously, pressure tests were combined into a single PDF as Doc Type = Test data. Now, that Sub Doc Type = T-OTH or PRES-G depending on the province. Although the most recent documents will still have the Doc Type = Test categorization, they also have more granular categorizations of Sub Doc Types: AOF, GAN, OAN, CLEAN-UP, and more.
Drag a column header into the pane above the data grid as depicted to automatically group according to that criteria. Drag additional child headings into the row to sort subgroups within the main group.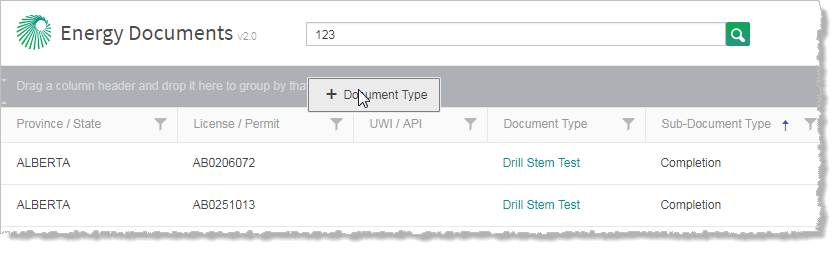
An indicator label appears in the display row. Where there are other types of filtering applied, the grouping indicator label is colored blue and is preceded by the Groups heading . To remove an item from the pane above the data grid, click X in the right of the item, as depicted below.
The left-most column header in the sort pane controls primary sorting, the next column header to the right of it controls secondary sorting, and so on. Drag a column header left of its neighbor to change the group hierarchy.
Click the arrow in the left of the filter label to change the sort order displayed in the column between ascending and descending.

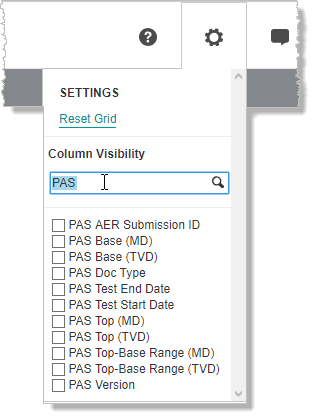
If you know even a portion of the column header name you are seeking in the drop-down list, in the search box just below the Column Visibility title, type consecutive characters that appear in the column name.
- Clear and select the various columns to hide and show. The changes are automatically applied to the main grid.
- Move the cursor away from the SETTINGS menu to close it.
Click Reset Grid to reapply the default settings.
Drag a column to the left or right of another to change the display order.
Drag a column border in the column heading row to resize a column, or double-click the column divider between two columns to automatically fit the column width as depicted below.
Customize the number of items displayed per page in the bottom left. This setting is saved in your grid preferences providing you accepted the cookie. This setting adjusts how many records appear in the grid and thus how many total pages your results require.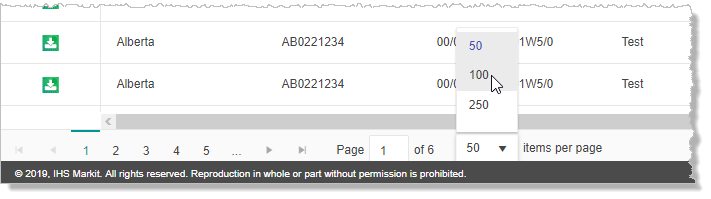
Hover over the image above to enlarge it.
This information appears in the bottom right of the window, below the results grid.
Navigate the pages either clicking the single page arrows ( ,
,  ), jumping to the last or first page (
 ,
,  ), or clicking a specific page number or typing a specific page number in the Page box.
Some data is from the S&P Global Data hub, other data is pulled directly from the files submitted to the regulatory agency, and thus, has not verified this data. Click a column header in the table below to sort that column and its related cells in ascending or descending order.
| Data Field | Description | Source |
|---|---|---|
| Base (MD) | PAS File1. | |
| PAS Related | ||
| Base (TVD) | PAS File | |
| Test End Date | PAS End date is typically drawn directly from the PAS file; however, for GAN, OAN, and WAN, the analyzed date as the end date. | PAS File |
| Test Start Date | PAS Test Start is typically drawn directly from the PAS file; however, for GAN, OAN, and WAN, the sampled date is used as the start date. | PAS File |
| Doc Type Abbrv | Generated by S&P Global | |
| Sub Doc Type | Generated by S&P Global | |
| Sub Doc Type Abbrv | Generated by S&P Global | |
| Classification | ||
| Completion Date | The date on which the well was completed. | |
| Completion Type | ||
| Confidential Date | The date on which the well status will no longer be Confidential. | |
| Confidential Type | ||
| Original Filename | ||
| Country | The country in which the well is located. | |
| County | The county or state in which the well is located. | |
| Licensee | ||
| Well Status | The well status (Abandoned, Producing, etc.) | |
| Document Date | ||
| Last Modified Date | ||
| Doc Type | ||
| Abandonment Date | The date on which the well becomes abandoned. | S&P Global Data (PPDM) |
| Drill TD | Total drilling depth. | |
| DST Number | ||
| Well Alias Effective Date | ||
| File Extension | ||
| File Size | The size of the file on disk. | |
| Final Drill Date | The final date on which the well is drilled. | |
| AER PAS Identifier Code | ||
| License/Permit | ||
| Operator | The code of the well operator. | |
| PAS Unit | ||
| PAS version | ||
| PDF Page Count | The number of pages in a given PDF. | |
| View/Download | ||
| Profile Type | ||
| Province/State | The province or state in which the well is located. | |
| Rig Release Date | The date that the drilling rig was removed from the well site. | |
| Source | ||
| Status_Type | ||
| Well Alias Type | S&P Global Data (PPDM) | |
| Bottomhole Latitude | The bottomhole latitude. | S&P Global Data (PPDM) |
| Surface Latitude | The surface hole latitude. | |
| Surface Location Datum | The datum upon which the surface hole location is based. | |
| Surface Longitude | The surface hole longitude. | |
| Bottomhole Longitude | The bottomhole longitude. | S&P Global Data (PPDM) |
| Bottomhole Location Datum | The datum upon which the bottomhole location is based. | S&P Global Data (PPDM) |
| OCR Text Content | Text from submitted energy documents that was digitized during the optical character recognition process. | |
| Top - Base Range (MD) | ||
| Top - Base Range (TVD) | ||
| Top (MD) | The measured depth of a given top. | |
| Top (TVD) | The true vertical depth of a given top. | |
| UWI/API Unformatted | The well identifier without slashes or dashes. | |
| UWI/API | The well identifier with slashes and dashes. | |
| Well Alias | ||
| Well Name |
1- The regulator defines numerous fields that are categorized within a PAS file. For a list of these fields, refer to http://aer.ca/documents/dds/PASFileFormats.xls